John P Capitanio,1,2 Sally P Mendoza,1,2 Michael McChesney2
1Department of Psychology and 2California Regional Primate Research Center, University of California, Davis, CA, USA
Accepted for publication November 26, 1995.
Abstract
The influences of housing location and temporal factors on the results of blood sampling were examined to determine their contributions to levels of hypothalamic-pituitary- adrenal hormones, as well as leukocyte subset counts from peripheral blood in rhesus monkeys. Differences in housing location and the amount of room disturbance associated with blood sampling have a significant impact on cell counts, but not on ACTH or cortisol levels.
Key words: immune system - stress - psychoneuroimmunology - methods - husbandry - cortisol - lymphocytes - CD4+ cells - CD8+ cells
Introduction
It is a truism in science that the procedures one employs are an important contributor to the nature and quality of the results obtained. A critical aspect of one's procedures, especially when assessing dynamic systems, is timing. Measures made at one point in time may differ substantially from measures made at a different point in time, owing to the presence of endogenously generated ultradian, circadian, or seasonal rhythms [12], for example. Another particularly important temporal factor that can influence results obtained from measurement of a dynamic system is the duration of the measurement itself. If the measurement takes some nontrivial amount of time to make, one runs the risk that a result from the end of the measurement period could differ from a result generated earlier.
One practical aspect of the role of temporal influences on procedures used for blood sample collection in captive nonhuman primates concerns the fact that animals are typically housed with other animals, either in a social group or individually in a room with other individually housed animals. To what extent does the disturbance involved in sampling blood from one animal influence the sample drawn from the next animal? A series of studies conducted with rats and fowl have explored this question of sampling order on measures of pituitary-adrenal activity [6-9]. In general, no order effects were found in socially housed animals following removal for blood sampling, so long as the animals were returned to their groups. There are few data on whether sampling order effects occur in nonhuman primates. The only published data of which we are aware involved studies of individually and socially housed squirrel monkeys, and indicated that plasma cortisol and ACTH levels did not reflect sampling order [2, 3, 10].
Less is known about how temporal factors affect physiological systems other than the pituitary-adrenal system. The present studies were designed to investigate whether disturbance associated with blood collection might be associated with variability in counts of circulating leukocyte subpopulations. Blood samples were drawn sequentially from monkeys living in a single housing room. To the extent that corticosteroids are a major influence on trafficking of lymphocyte populations [5, 11, 13], one would expect that any temporal influences (or lack thereof) on pituitary -adrenal hormones would be reflected in numbers of circulating lymphocytes. On the other hand, lymphocyte migration is influenced by many factors other than circulating corticosteroid levels, and so effects of prior disturbance on lymphocyte counts may be evident in the absence of adrenocortical effects. Finally, in the course of our study we discovered unexpected influences of housing location on our hormonal and hematological measures, and present these data as well.
Experiment 1
Methods
Subjects
The subjects were 37 adult male rhesus macaques (Macaca mulatta). The mean age of the subjects was 6.4 years (range: 5.1-8.4 years). All animals were born into half-acre breeding enclosures at the California Regional Primate Research Center and lived there until adulthood. Approximately four weeks prior to initiation of data collection for this study, all subjects were removed from their natal groups (animals were drawn from eight field cages) and moved into individual cages indoors.
Housing
Animal caging was located in a single room measuring 8.9 in in length by 3.3 in wide, with a sloping ceiling (2.7-3.2 in high). Abutting the room was a smaller work room (1.4 x 3.3 x 2.4 in), which could be entered from the outside through metal doors. A second pair of metal doors, each measuring 0.7 m x 2.1 m, were approximately centered along the width of the common wall between the work room and the housing room. These inner doors were the only means of entry to the housing room. Centrally placed in the upper half of the left inner door was a small window (17.1 x 25.4 cm), permitting visual examination of the housing room prior to entry.
Animals were housed individually in standard laboratory squeeze-back cages in four rows in the housing room. Animals were randomly assigned to the cages within the room, with the condition that animals drawn from the same field cage were housed across from each other insofar as possible. As viewed from the work room, the rows were top left (n = 7), bottom left (n = 10), top right (n = 9), and bottom right (n = 11). Altogether, 40 monkeys were housed in this room. (The three other animals were not part of this study. Two were housed on the top left, and the third was housed on the bottom left.) All daily husbandry procedures were completed at least 30 minutes prior to blood sampling on each day.
Procedure
Blood was sampled from all monkeys in a particular row in a single sampling session. The four sampling sessions occurred within a four week period, in the following order: top right (TR), bottom right (BR), bottom left (BL), and top left (TL). The blood collection strategy emphasized sampling animals housed adjacently, beginning with the animal from each row that was closest to the entry doors, and proceeding to the end of the room. Because we wanted to sample no more than 10 animals per day, the last animal located in each of the bottom two rows were sampled as the final animals on the days when the corresponding top row animals were bled.
Sampling teams comprised four technicians, two of whom were responsible for restraining the animals via the intracage squeeze mechanism and for drawing the blood, one who recorded the times, and one who distributed the samples into the tubes. This procedure was employed for all but the BR samples. On this day, the two technicians who drew the blood, rather than working together on each animal, worked separately, alternating the 10 monkeys in a leapfrog fashion, in an attempt to minimize sample collection times.
On each day of sample collection, syringes and sample tubes were prepared in advance and organized in the work room. Approximately five minutes of activity occurred in this area prior to opening the doors to the housing room between 2:50 p.m. and 3:00 p.m. Coincident with opening the doors, a stopwatch was started and ran continuously until the last blood sample was obtained for that day; thus all times recorded were cumulative times from the point of room entry. For each monkey two times were recorded: The contact time was the time at which the first technician stepped in front of a monkey's cage, and the collection time was the time when the technician removed the needle from the monkey's antecubital vein.
For each monkey, 7.0 ml of blood was drawn. Immediately following sample collection, 1.5 ml of blood was transferred into each of two tubes containing EDTA for subsequent analysis of a)ACTH and cortisol, and b) complete blood counts (CBC), differential cell counts, and CD4+/CD8+ counts. The remaining 4 ml were placed into a separate tube for additional analyses not reported here.
Sample assays
Adrenocorticotropic hormone (ACTH) and cortisol. Levels of ACTH and cortisol were estimated by radioimmunoassay using commercial kits (Diagnostic Products Corporation, Los Angeles, CA). Intra- assay coefficients of variation were 11.0% for ACTH and 11.9% for cortisol. Interassay coefficients of variation were 5.0% for ACTH and 14.5% for cortisol.
Complete blood counts. Samples were evaluated with a Serono Baker Diagnostic System (Allentown, PA), and all electronic counts were verified by a manual differential. Coefficients of variation were computed for the three principal leukocyte measures considered here (total leukocytes, segmented neutrophils, total lymphocytes). Less than 5% variation was found for total leukocyte numbers for 10 samples that were assessed twice using the Serono Baker machine. Manual counts for total lymphocyte and segmented neutrophil counts were made by two technicians for 10 samples. Less than 10% variation was found on these measures.
CD4+/CD8+. T lymphocyte antigens were detected by direct labeling of whole blood with fluorescein- conjugated anti-human CD8 (Leu-2a; Becton Dickinson, Mountain View, CA) and phycoerythrin- conjugated anti-human CD4 (OKT4; Ortho Diagnostic Systems, Raritan, NJ). Red blood cells were lysed and the samples were fixed in paraformaldehyde using the Coulter Q-prep (Coulter Corp., Miami, FL). Lymphocytes were gated by forward and side light scatter, and were then analyzed with a FACSCAN flow cytometer (Becton Dickinson). For 12 blood samples, duplicate aliquots were made, analyzed, and compared. Coefficients of variation for CD4+ and CD8+ lymphocyte numbers were computed as less than 10%.
Data analyses
The principal variable of interest was disturbance time, computed for each animal as the amount of time elapsed from initial entry into the room until the needle was withdrawn from its arm. A second time- based measure of interest was the draw time, computed as the elapsed time from initial disturbance of a particular animal until the needle was withdrawn. Dependent measures were values for ACTH, cortisol, and cell counts (total leukocytes, lymphocytes, neutrophils, CD4+ T-lymphocytes, CD8+ T-lymphocytes, and CD4/CD8 ratios) derived from the four days of blood sampling. Two analyses were performed. First, a one-way ANOVA for housing location was performed for each dependent measure. Because differences among housing locations were found, analysis of the influence of draw time involved an analysis of covariance using hierarchical multiple regression for draw time. In this technique, the covariate is entered on the first step, followed by the variable of interest on the second step, and the change in R2 from step 1 to step 2 is tested using an F-test. This change in R2reflects the increment in variance explained after statistically controlling for the effects of the covariate.
On the first step, the four locations, dummy coded as three variables, were entered. The reference group for this analysis was chosen as bottom right (BR), owing to the results of the analysis of variance for location. On the second step, the draw time was entered, and the result was examined for a change in the amount of variance explained in the outcome measures after controlling for location. The analysis of disturbance time proceeded in the same fashion. Because we were interested in determining specific cut-off times to be used in guiding future blood sampling efforts, we employed dichotomized codes of disturbance time, rather than treating this variable as a continuous measure. Five dichotomized codes were created and a separate analysis was run for each dependent measure and for each code. Animals were categorized by whether their disturbance times were less than or equal to versus greater than 9, 12, 15, 18, and 20 minutes. For all analyses reported in this paper, the assumption of regression homogeneity was met. Further details of hierarchical multiple regression and dummy coding may be found in [4].
Because we were concerned that outliers might adversely affect our ability to discover relationships between disturbance time and our measures, animals were excluded from the analysis if their values were greater than two standard deviations above the mean. The number of animals so excluded ranged from none (leukocytes) to three (cortisol). Similarly, we wanted to insure that if there were indeed effects of location, draw time, or disturbance time on our measures, that we would not make a Type 11 error and erroneously conclude that no such effects were present. Consequently, we present all results where P < . 10.
Results
Effects of housing location
Analyses of variance revealed that housing location was an important influence on hormone levels and cell counts. Significant effects of location were found for cortisol levels [F(3,30) 3.49, P < .05] and lymphocyte numbers [F(3,32) 3.58, P < .05]. Inspection of means and subsequent Newman-Keuls tests revealed that 1) BR monkeys had significantly lower cortisol levels than did monkeys housed on the left side of the room (mean values were BR, 9.03 µg/dl; TL, 14.43 [µg/dl; BL, 12.94 µg/dl) and 2) TR monkeys had significantly higher lymphocyte counts than did monkeys in the other three rows JR, 6,354.3 cells/µl; BR, 4,879.5 cells/µl; BL, 4,971.9 cells/µl; TL, 4,355.4 cells/µl).
The greatest location differences were found between BR and the other monkeys, particularly TR and TL animals. Rather than position per se, the differences could reflect total disturbance time. Ten of the 11 monkeys in the BR group were bled using a slightly different procedure, aimed at minimizing collection time. (The remaining monkey was bled on the same day as were the TR monkeys.) In fact, disturbance time for these 10 BR monkeys was 12.4 minutes, which was shorter by half than the times for monkeys in the other locations. To test the hypothesis that location, and not disturbance time was the critical factor, two additional ANOVAs wen performed. In the first, data for the four location., were included only if the disturbance time was less than 744 seconds, the time at which the 10th sample was taken for BR animals. Further elimination of animals whose data were more than two standard deviations above the mean resulted in cell sizes of from two to five in the three remaining cells; consequently, we urge caution in interpretation. Nevertheless, results of this analysis were very similar to results of the previous one. Significant effects of location were found for cortisol [F(3,16) = 5.67, P <.01], with TL and TR levels significantly greater than BR levels, and a near- significant effect of location was found for lymphocytes (P < .07), with TR having the highest values and TL having the lowest. The second analysis contrasted only those monkeys in the TR, TL, and BL rows, for which the blood sampling procedures were the same. In this analysis, significant location differences were found for lymphocytes [F(2,22) = 6.09, P < .0 1] and CD4+ lymphocytes [F(2,2 1) = 3.78, P < .05]. Monkeys in the TR row had significantly higher lymphocyte counts than did monkeys in the TL and BL rows, and significantly higher CD4+ lymphocyte counts than did monkeys in the TL row. Thus, because differences between locations were largely maintained once disturbance time and sampling procedures were equated, we reject the alternate hypotheses that disturbance time and sampling procedures, per se, accounted for location differences.
Effects of draw time
After controlling for location effects in the multiple regression analysis, no significant influence of draw time was found for any outcome measure (all P > .25). The change in R 2 resulting from adding draw time to the regression equation ranged from 0% (segmented neutrophils) to 3.1 % (CD4/CD8 ratio). R2 -change values for cortisol concentrations, and lymphocyte, CD4+, and CD8+ counts were less than 3.0%. Mean draw time was 116.3 seconds (range: 55-226 seconds).
Effects of disturbance time
Following statistical control of location in the regression analyses, disturbance time was a contributor to the variance in several of our dependent measures.
CD4+ T-lymphocytes. CD4+ counts were influenced by disturbance time at the 9-minute (R2 change =.095, P < .06), and significantly at the 12-minute (R2 change = .140, P < .05) time points. In both cases, animals sampled earlier had higher CD4+ counts than did animals sampled later.
CD8+ T-lymphocytes. CD8+ counts were influenced by disturbance time at the 12-minute (R2change = .093, P < .07) and 15 -minute (R2 change = .099, P < .06) time points, with animals sampled earlier having higher CD8+ counts than animals sampled later.
Lymphocytes. Total lymphocyte counts were affected by disturbance time at the 12-minute (R2 change =.083, P < .06) and 20-minute (R2 change = .119, P < .05) time points. Animals sampled earlier had higher lymphocyte counts than did animals sampled later.
Discussion
The results indicate that housing location and the amount of disturbance that the animals experience in their rooms during blood sampling has an impact on hormonal and hematological parameters of blood samples drawn under baseline conditions. Draw time exerted a negligible effect on our measures. Our analysis revealed significant and unexpected effects of cage location on plasma cortisol concentrations and lymphocyte counts: Cortisol levels in the BR monkeys were 70% of those in the next lowest group, and lymphocyte counts were 28% higher in the TR group compared with those in the next highest group. Results of the subsequent analyses indicated, moreover, that these effects were largely maintained once the groups were equated for disturbance time and sampling techniques, suggesting that it was not our procedures, but some aspect of housing location per se that influenced the results.
We believe that the critical factor that explains our housing location results is the presence of the window in the left-most door separating the housing room from the work room. In general, animal care staff work in the outer work room periodically throughout the day. Once they enter the work room all monkeys are exposed to the noise of talking, the outer doors opening and closing, and things being moved around. Whereas all monkeys experience these auditory stimuli equally, visual stimuli are not available to the animals equally; several of the TL and BL monkeys can easily see some of the activity in the work room, owing to the location of the window (to the left of the room's midline) and the fact that most of the activity takes place on the right side of the work room. In particular, entry to the work room from the outside permits immediate visual contact with the first few animals in the TL row. TR monkeys also have access to visual stimuli, as they can see people walking over to, and using the sink. BR monkeys have the least access to visual stimuli from the work room.
It is possible that the placement of the window resulted in a general difference in physiological activation between monkeys in the four rows. The nature of such a difference in activation - for example, whether it is a persistent feature of such a housing arrangement, or is relevant only for animals who are not yet well-habituated to the change to single-cage housing, as may have been the case with our animals-cannot be known from the present results. The five minutes of preparation prior to the blood sampling in the present study, however, may have exacerbated this difference. In fact, the pattern of results reported here for cortisol and lymphocytes parallels the amount of visual access the animals may have had to our technicians: In general, monkeys in the BR row had values on our measures that were opposite in direction to those observed among left- and/or top-housed monkeys. In a sense, this interpretation is unsurprising. Given that direct eye-to-eye contact is usually interpreted by rhesus monkeys as a threat (particularly by adult males), it seems reasonable to infer that differential access to visual information (much of which involves direct eye contact between monkey and technician) might correlate with measures that typically reflect stress: higher cortisol and lower lymphocyte levels. If this interpretation is correct, then equating access to visual information for all animals, by keeping the window permanently covered, should have the effect of eliminating the location differences.
As expected, no effect of disturbance time was found for plasma cortisol concentrations, a result consistent with those reported in several studies of fowl [6-9] and monkeys [2, 3, 10]. Substantial effects of disturbance time were found, however, for lymphocyte and lymphocyte subset counts, with effects seen in as little as nine minutes following our entry into the housing room. Unfortunately, because our measure of disturbance reflected time from entry into the housing room, we could not determine from these data whether the preceding five minutes of auditory/visual disturbance in the work room might also have influenced our results. For this reason, and because we wished to determine whether covering the window between the entry and housing rooms might eliminate the location differences for cortisol and lymphocyte numbers, we initiated another round of blood sample collection three months following the previously described one, and present the results here.
Experiment 2
Methods
Subjects
The subjects were 36 of the adult male rhesus macaques described previously.
Housing
Housing for all animals was in the same colony room. One month following the completion of Experiment 1, an opaque cover with hinges was placed over the window to prevent continuous visual access to the work room. One month later, the animal housing room was reorganized, principally to accommodate larger housing cages (resulting in nine cages per row) and to remove the four animals that were not part of the larger project. In addition six of the heaviest animals were moved to bottom rows. Altogether, 14 of the 36 monkeys were relocated to different rows on the same side of the room, two monkeys were relocated to different positions within their original rows, and one monkey was relocated to the opposite side of the room. Cage assignments were made by a technician who was blind to the aims of this study. As before, all daily husbandry procedures were completed at least 30 minutes prior to blood sampling on each day.
Procedure
One month following room reorganization, blood sampling began. Blood was sampled from nine monkeys on each of four consecutive test days, in the following order: bottom left (BL), top left JL), bottom right (BR), top right JR). The blood collection strategy again emphasized sampling animals housed adjacently, beginning with the animal from each row that was closest to the entry doors, and proceeding to the end of the room. Sampling teams were as previously described.
There were three differences in procedure in this round of sampling compared with Experiment 1. First, all blood samples were collected in a leapfrog fashion, as was done with the BR monkeys from Experiment 1. Second, virtually all preparation work prior to sample collection was done outside the building. The technician operating the stopwatch began recording time not from entry into the housing room, but from entry into the work room from the outside. Thus, all disturbance time in this experiment includes the minimal preparatory auditory stimuli from the work room. Third, strict timing criteria were employed. Samples had to be collected with a maximum draw time of three minutes, and the final sample could be collected no later than 15 minutes following initial disturbance. Five samples were redrawn as they did not satisfy these criteria (four samples had draw times greater than 3 minutes, one had a disturbance time greater than 15 minutes; two samples were located in the TL row, and one each in the remaining three rows). Samples were redrawn (using identical procedures) the following week. The disturbance times for the five redrawn samples ranged from 3.4 to 10.8 minutes.
Data analyses
The same analytic strategy was employed as described for Experiment 1. Because our disturbance times were all under 15 minutes, however, our analyses employed three dichotomized codes: 6, 9, and 12 minutes.
Results
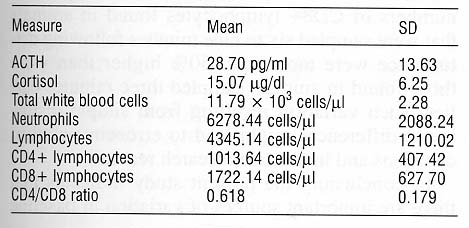
Table I presents descriptive statistics for all measures for all animals.
Effects of housing location
No significant effects of housing location were found for any measure, including plasma cortisol (P > .30) and lymphocytes (P > .80).
Effects of draw time
Regression analyses revealed no significant effects of draw time for any measure (all P > .17).
Effects of disturbance time
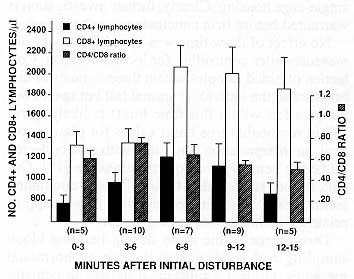
Figures 1 and 2 display the values of our hematological measures as a function of disturbance time. Results of the statistical analysis revealed several effects of disturbance time.
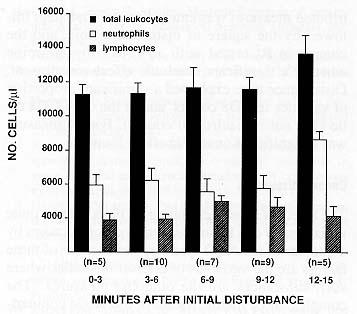
CD8+ T-lymphocytes. Disturbance time explained a significant amount of variance in CD8 counts at the 6- minute time mark (R2 = .269, P < .01), with animals sampled later having higher counts. 04108 ratio. Disturbance time was related to the CD4/CD8 ratio at the 6-minute (R2 149, P < .05), and 9- minute (R2 = .152, P < .05) time marks. In all cases, animals sampled later in a session had lower CD4/CD8 ratios.
Neutrophils. Animals sampled after 12 minutes of disturbance had higher neutrophil counts (R2 = .211, P < .05) as compared with animals sampled earlier.
Nonlinear effects of disturbance time. Because Figures 1 and 2 suggest nonlinear relationships may exist between disturbance time and our hematological measures, a follow-up multiple regression analysis was performed. Disturbance time (as a continuously distributed measure) was entered on the first step, followed by the square of disturbance time, and the change in R2 tested with an F-test to determine whether a significant quadratic effect was present. Disturbance time explained a significant proportion of variance in CD8 counts, and in the CD4/CD8 ratio (but not in neutrophil counts). For no measure was a significant quadratic effect found.
General discussion
The levels, of substances borne by blood can be quite variable and can be influenced in complex ways by a number of factors. Typically, one or more of these factors are the variables of interest in studies where such substances are the outcome measures. The complex and dynamic nature of the blood compartment, however, necessitates careful control of extraneous factors. We have demonstrated that housing location and disturbance time, but not draw time (at least within the range of approximately three minutes examined here), had a significant impact on plasma concentrations of stress-related hormones and leukocyte subset counts assessed from baseline blood samples.
In Experiment 1, unexpected differences in our measures were found between animals housed in different rows. Installation of a window cover in Experiment 2 eliminated the location effects, suggesting that it was the monkeys' unequal visual access to the work room, and not other extraneous factors, that was responsible for the location differences found. Unfortunately, we cannot tell from these data whether unequal access to visual information exerts a continuous effect on physiological measures for all animals, or is influential only for animals that may not have habituated completely to single-cage housing. Clearly, further investigation is warranted before firm conclusions can be drawn.
No effect of draw time was found for any of our measures after controlling for location effects. Collection of blood samples within three minutes of disturbance to the individual animal (all but two of our samples fell within this time limit) is likely to result in reasonably true basal values for plasma cortisol, an interpretation consistent with data collected on laying hens [91 and squirrel monkeys [10]. Our data further suggest that for ACTH and circulating leukocytes a three minute draw time may be appropriate for estimation of resting levels.
Disturbance in the room during baseline blood sampling had a minimal influence on hormonal measures, but had a substantial impact on hematological measures, particularly lymphocyte counts and lymphocyte subset counts and ratios. Moreover, results from the second experiment indicate that this influence appears soon after the initial disturbance. CD8+ lymphocytes appeared particularly susceptible to disturbance - as revealed in Experiment 2 and displayed in Figure 2, animals bled six minutes or more after initial room disturbance had significantly higher CD8+ values than those found in monkeys sampled within six minutes of initial disturbance. Consistent with this result, CD8+ values were substantially higher in Experiment 1 (in which overall disturbance times were greater for more animals) than in Experiment 2. Nevertheless, with continued disturbance, the numbers of CD8+ and CD4+ lymphocytes eventually decline, as indicated by the analyses for these measures at the 12- and 15-minute time points in Experiment 1. (Note that by including the five minutes of auditory disturbance in the work room during this experiment, these results would more accurately reflect approximately 17-20 minutes of disturbance.) Finally, neutrophil counts showed evidence of being influenced by disturbance time, as their numbers were higher after 12 minutes of disturbance.
The identification of disturbance time as a significant contributor to variance in leukocyte subset counts has two important implications. First, the fact that different cell subsets are affected somewhat differently by room disturbance [particularly with respect to timing (early vs. late) and direction of influence (increases vs. decreases)] suggests that different regulatory mechanisms may be operating on the different cell types and the tissues in which the cells typically reside [11, 14]. It is particularly interesting in this regard that some leukocyte measures are responsive to disturbance time when ACTH and cortisol apparently are not [1]. Thus, it does not appear that the disturbance-induced changes in CD8+ T-lymphocytes, CD4/CD8 ratio, or neutrophils are secondary to hypothalamic-pituitary-adrenal stress responses.
A second important implication of this research is practical in nature. Just as it is now customary to consider timing issues when sampling blood for pituitary-adrenal hormone assays, the present data indicate that sampling time, and particularly disturbance time, must be considered when the measures of interest are leukocyte counts. This is important for both clinical and research uses of these hematological measures. In Experiment 2, for example, the numbers of CD8+ lymphocytes found in animals that were sampled six to nine minutes following disturbance were more than 50% higher than were those found in animals sampled three minutes earlier. Such variation resulting from simple disturbance differences might lead to erroneous clinical decisions and inaccurate research results.
In conclusion, the present study indicates that there are important sources of variation in baseline hormonal and hematological outcome measures for adult male rhesus macaques associated with housing and disturbance arising from the blood sampling process itself. Housing effects can be minimized for stress-related measures by ensuring that animals housed in the same room have equal access to visual and auditory stimuli. Disturbance time, in contrast, is a factor that appears to require strict control during blood sampling. The present study also suggests that counts of leukocyte subpopulations are more sensitive measures of prior disturbance than are levels of pituitary-adrenal hormone.
Acknowledgments
This research was supported by USPHS, NIH grants MH49033 and RROO169. The authors thank P.C. Allen, H. Louie, M. Norman, and D.M. Schoen for their technical assistance in data collection.
References
1 . ADER R, FELTEN DL, COHEN N: Psychoneuroimmunology, 2nd ed. New York: Academic Press, 199 1.
2. COE CL, MENDOZA SP, DAVIDSON JM, SMITH ER, DALLMAN MF, LEVINE S: Hormonal response to stress in the squirrel monkey. Neuroendocrinology 36:367-377, 1978.
3. COE CL, MENDOZA SP, LEVINE S: Social status constrains the stress response in the squirrel monkey. Physiol Behav 23:633-638, 1979.
4. COHEN J, COHEN P: Applied Multiple Regression/Correlation Analysis for the Behavioral Sciences. Hillsdale, NJ: Lawrence Erlbaum, 1975.
5. FAUCI AS, DALE DC: The effect of in vivo hydrocortisone on subpopulations of human lymphocytes. J Clin Invest 53:240-246, 1974.
6. HENNING SJ: Plasma concentrations of total and free corticosterone during development in the rat. Am J Physiol 235:E451-E456, 1978.
7. JONES RB, HARVEY S: Behavioural and adrenocortical responses of domestic chicks to systematic reductions in group size and to sequential disturbance of companions by the experimenter. Behav Proc 14:291-303, 1987.
8. HARVEY S, MERRY BJ, PHILLIPS JG: Influence of stress on the secretion of corticosterone in the duck (Anas platyrhynchos). J Endocrinol 87:161-171, 1980.
9. LAGADIC H, FAURE JM, MILLS AD, WILLIAMS JB: Effects of blood sampling on plasma concentrations of corticosterone and glucose in laying hens caged in groups. Br Poultry Sci 31:823-829, 1990.
10. LYONS DM, MENDOZA SP, MASON WA: Psychosocial and hormonal aspects of hierarchy formation in groups of male squirrel monkeys. Am J Primatol 32:109-122, 1994.
11. OTTAWAY CA, HUSBAND AJ: Central nervous system influences on lymphocyte migration. Br Behav Immun 6:97-116, 1992.
12. QUABBE H, GREGOR M, BUMKE-VOGT C, WITT I, GIANELLANETO D: Endocrine rhythms in a nonhuman primate, the rhesus monkey. Adv Biol Psychiatry 11:48-59, 1983.
13. SPRY, OF: Inhibition of lymphocyte recirculation by stress and corticotropin. Cell Immun 4:86-92, 1972.
14. OTTAWAY CA, HUSBAND AJ: The influence of neuroendocrine pathways on lymphocyte migration. Immun Today 15:511-517, 1994.
This article originally appeared in the Journal of Medical Primatology 25, 26-33 (1996).
Reprinted with permission of the author.